


Has anyone ever attempted to create a graph of measured distance between points on a three-dimensional human form (or just a head) and an abstract surface or hypothetical plane using gray-scale tones or luma to represent the data? In other words has anyone produced a heightmap? See http://en.wikipedia.org/wiki/Heightmap?
I contend that such a set of measurements would produce a fuzzy, ghost like representation of the body form and not the detailed and realistic image we see on the shroud. This would be true for both linear and curved gray-scales. The image on the shroud does not represent collimated body to cloth distance. The claim that it does is pure fiction. I suggest that the VP-8 Image Analyzer was not used correctly thus leading to a lot of misunderstanding.
What is interesting is that if you apply two-dimensional (xy) Gaussian filters to a digital shroud of Turin image, you create a heightmap equivalent. That gives a good plot. Given that it is mathematically impossible to go the other way, just as you cannot find the dividend and the divisor from the quotient, it would be impossible to produce the actual image on the shroud from the data derived. This may be the biggest mystery of all.
That is hard to understand. However, what follows is an edited reposting from February that may help.
What is right or wrong with the material from page 9 of The Shroud: A Critical Summary of Observations, Data and Hypotheses, by Robert W. Siefker and Daniel S. Spicer, which states in Table I, Item 3.0:
The luminance distribution of both front and back images can be correlated to the clearances between the three-dimensional surface of the body and a covering cloth. This is why many state that the Shroud is a 3D image. . . .
The variation in the image density has been analyzed mathematically to render a high resolution 3-dimensional body image. While a photograph can be either a positive or a negative, there is no correlation in a photograph between the density of the imprint and the distance to the object. Uniquely, the image on the shroud appears denser in the areas where the vertical distance to the body from the cloth surface would logically be shorter. This allows the use of a simple mathematical function to recover the 3-dimensional information about the body. The 3-D characteristics present on the Shroud cannot be recovered with any normal reflected light photograph or painting.
We are being forced to think of this only in terms of a cloth covering a body. While this may be the case, this is an assumption and not an image characteristic. It should be avoided.
A better way to describe this is to use accepted terminology from the world of three-dimensional graphics. The image is a height-field or height-map.


The software uses several variables including an altitude scale, a viewing angle and a virtual light source to enable us to visualize the shape.


It is important to note, as
Siefker and Spicer state, a normal photograph or a painting is a representation of reflected light as detected by a camera or perceived from an artists viewing position.
There is no useful relationship between the gray scale values in a normal painting or photograph and spatial distance as found in height-fields.

Note: Height-field is a convenient term. Gray scale values found in such a dataset are applicable for both vertical and horizontal plots.
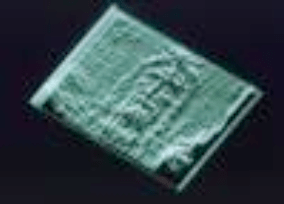
Here is an image I prepared using ImageJ. See: Do Your Own VP8-Like 3D Images of the Shroud of Turin

